Impact
Whether the thing you did moved the number.
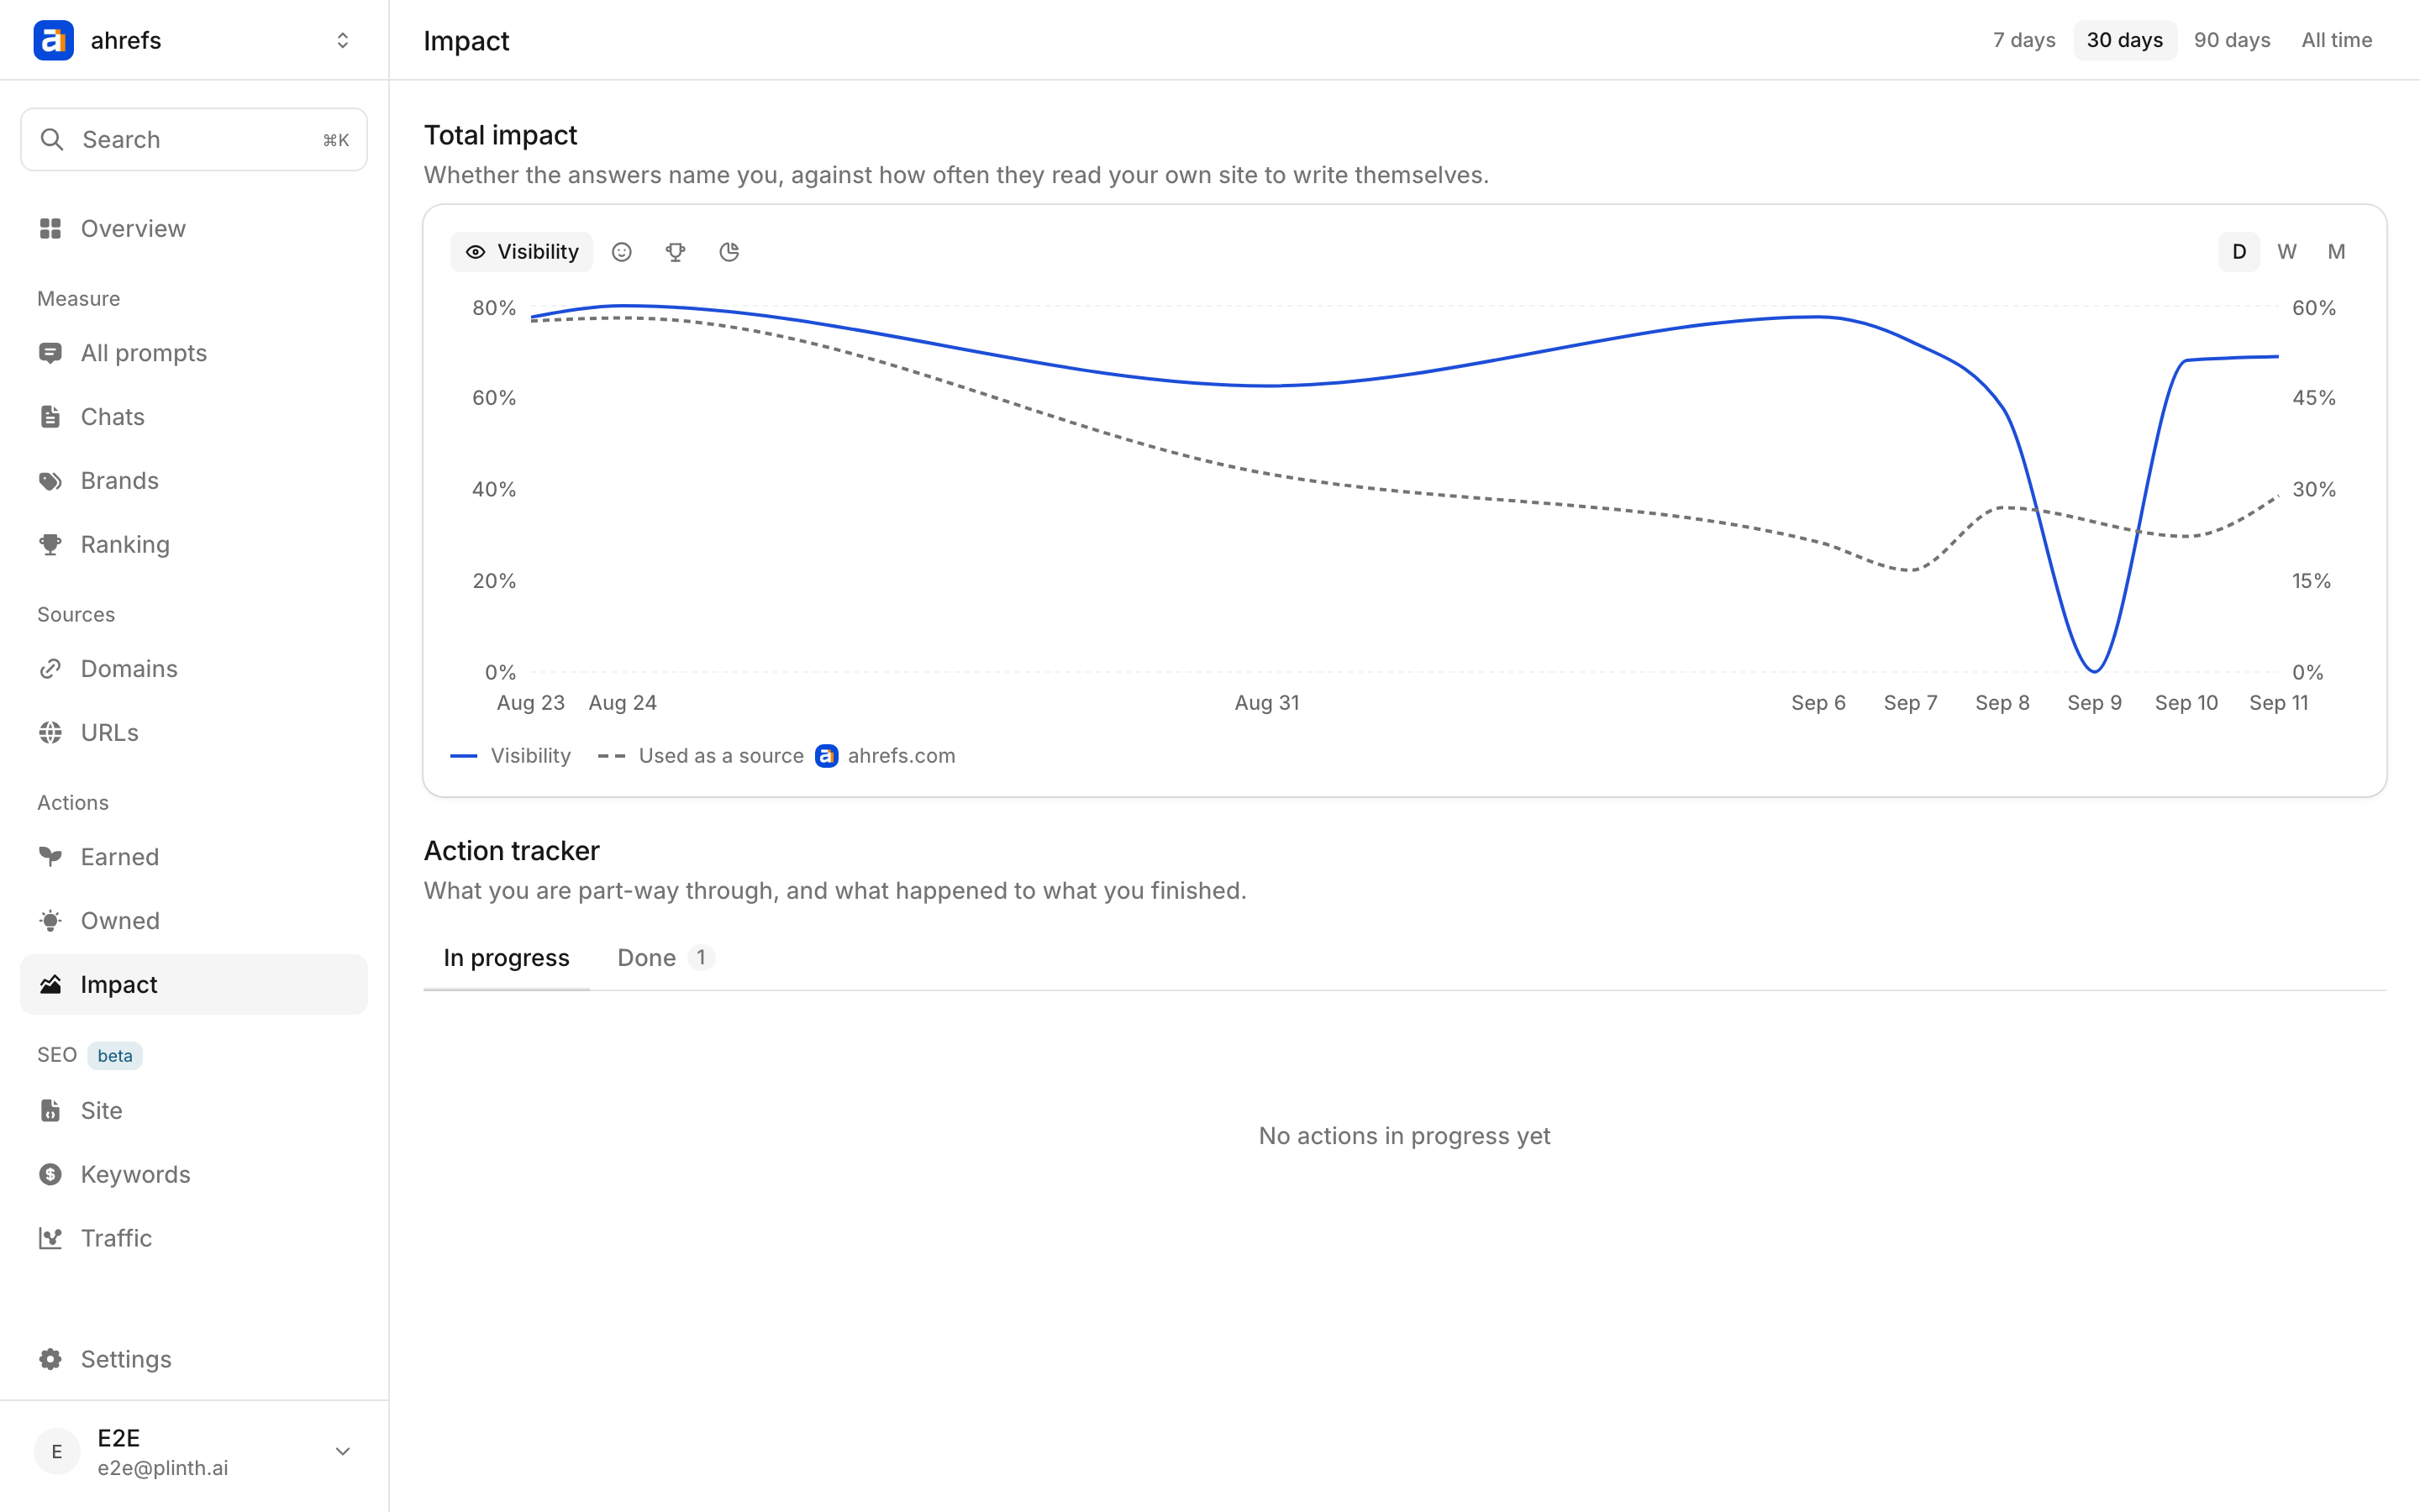
Most visibility work is done on faith: you write the page, you wait, and later the number is different for reasons nobody can name. Impact closes that loop twice over — a reading of where the brand is going, and a verdict on each thing you did.
Total impact
Two lines, because the page is asking two questions.
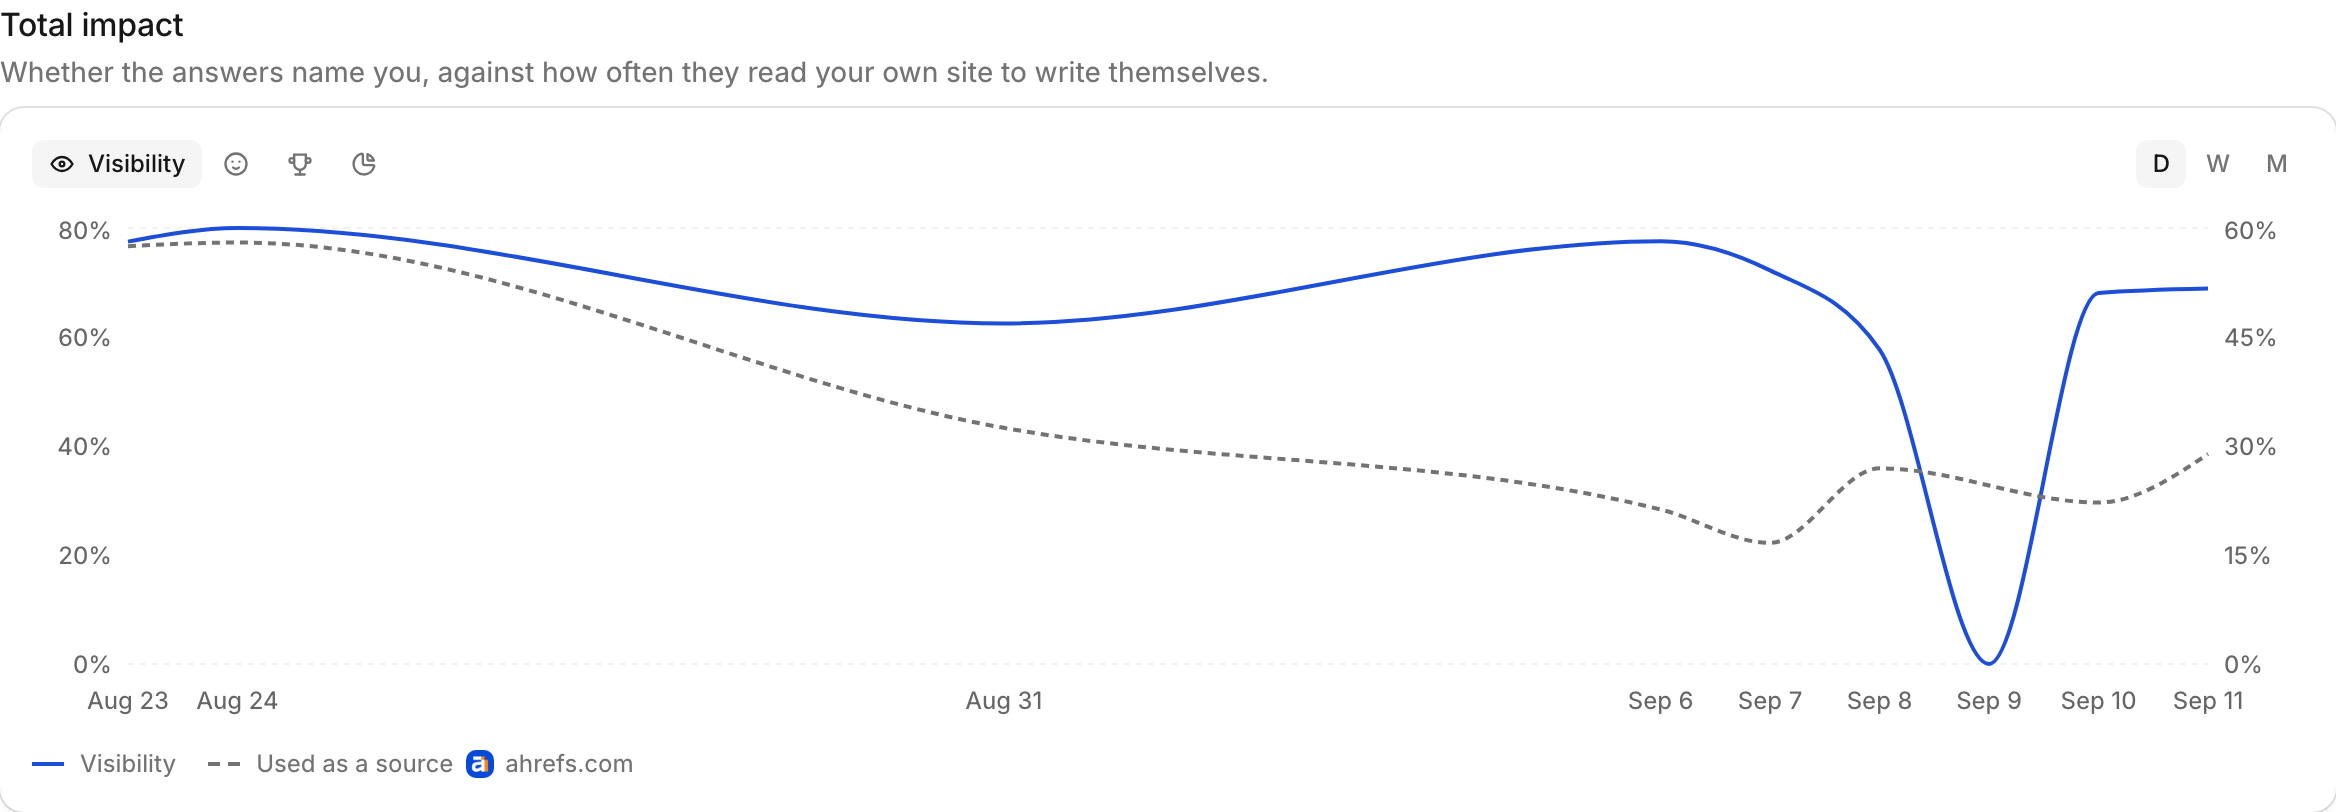
- Visibility (left axis) — whether the answers name you. The metric switcher reads sentiment, position and share of voice on the same axis.
- Used as a source (right axis) — how often the engines reached for your own site while writing those answers.
The second is the one worth watching while you work the Owned queue. Fixing a canonical or serving your content in the HTML changes whether an engine can read you before it changes whether it names you, so the dashed line moves first and the solid one follows. A page drawing only visibility would report that work as nothing happening.
Two axes rather than one, because the two are not on the same scale and forcing them together flattens whichever is smaller into the floor. Days, weeks or months through the D/W/M control, each bucket weighted by the chats behind it.
The gaps are real
Sampling is a backlog, so the days are not evenly spaced — a week nobody sampled is drawn as a week. An evenly spaced axis would make that week look like a week that did not move, and the days either side of it look like a cliff.
Action tracker
In progress is what somebody picked up: actions you accepted with Todo. An action nobody has answered yet stays on Actions, where it can be accepted or declined — counting it here would fill the tab with everything the product has ever thought of.
Done is the verdict, below.
How a verdict is reached
When an action is marked done, Recomma records the reading at that moment and then keeps sampling. Once there is enough on the other side, it reports:
- Before — visibility over the window leading up to the change, with its sample size.
- After — the same measurement since.
- Change — the difference, in percentage points.
An action stays in verifying until both sides rest on enough chats. That wait is the honest part: a before of eight chats and an after of six is two rumours, and reporting a difference between them would be inventing a result.
Percentage points, not percent
A move from 40% to 46% is six points. Calling it “up 15%” is technically defensible and consistently misread, so Recomma does not.
Statuses
| Status | Meaning |
|---|---|
| Open | Proposed, not started |
| In progress | Being worked on |
| Done | The work is finished; the clock has started |
| Verifying | Waiting for enough chats on the far side |
| Verified | Measured, with a before and after |
| Failed | Measured, and the number did not move |
| Dismissed | Declined — kept, so it is not proposed again |
Failed is deliberately not hidden. An action that did not work is the most useful row on the page: it is the cheapest way to learn that a kind of work does not pay in your category, and the alternative is doing it four more times.
What it cannot tell you
Impact reports a correlation over a window, not a controlled experiment. Other things move in that window — a competitor launches, a model changes its retrieval, the category gets more crowded.
Two habits make it trustworthy anyway:
- Check the intervals. A change smaller than the confidence interval on either side is not a change.
- Look for the mechanism. If visibility rose, the source you acted on should now show a higher with you on Sources. A number that moved with no matching change in the evidence behind it is a coincidence until proven otherwise.